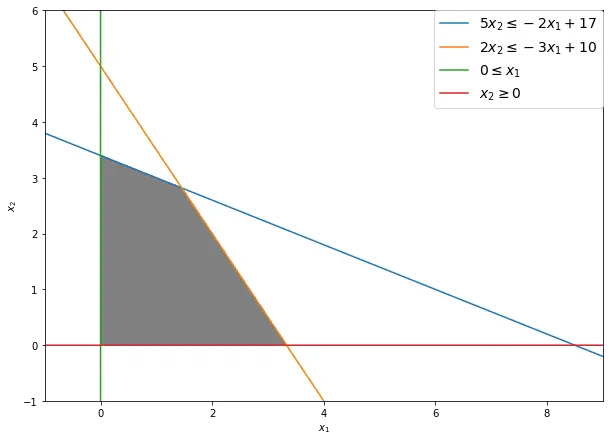
…for two variables
Imports
from typing import List

import matplotlib.pyplot as plt
import numpy as np
Code
OP = {
    "<": np.less,
    ">": np.greater,
    "==": np.equal,
    "<=": np.less_equal,
    ">=": np.greater_equal,
}
LATEX_OP = {
    "<=": "\leq",
    ">=": "\geq",
    "==": "\eq",
    "<": "<",
    ">": ">",
}


class Constraint:
    """
    Assumption:
        y INEQ x constant
    """

    def __init__(self, c_y: int, op: str, c_x: int, c: int):
        self.c_x = c_x
        self.c_y = c_y
        self.c = c
        self.op = op

    def to_line(self, x):
        return ((x * self.c_x) + self.c) / self.c_y

    def to_feasible(self, x, y):
        return OP[self.op](self.c_y * y, (self.c_x * x + self.c))

    def _str_constant(self):
        xy_str = []
        for constant in [self.c_x, self.c_y]:
            if abs(constant) == 1:
                ret = "" if constant > 0 else "-"
            else:
                ret = str(constant)

            xy_str.append(ret)

        if self.c_x != 0:
            xy_str[0] += "x_1"
        if self.c_y != 0:
            xy_str[1] += "x_2"

        return xy_str

    def __str__(self):
        constant_str = ""

        if self.c > 0:
            constant_str = f" + {self.c}"
        elif self.c < 0:
            constant_str = f" - {-self.c}"

        x_str, y_str = self._str_constant()

        return f"${y_str}{LATEX_OP[self.op]} {x_str}{constant_str}$"


def make_plot(
    min_xy: int,
    max_xy: int,
    constraints: List[Constraint],
    steps_feasible: int = 500,
    steps_lines: int = 2000,
):
    d = np.linspace(min_xy, max_xy, steps_feasible)
    x, y = np.meshgrid(d, d)
    fig, ax = plt.subplots(figsize=(10, 10))

    feasible_region = constraints[0].to_feasible(x, y)
    for c in constraints[1:]:
        feasible_region &= c.to_feasible(x, y)

    ax.imshow(
        feasible_region.astype(int),
        extent=(x.min(), x.max(), y.min(), y.max()),
        origin="lower",
        cmap="Greys",
        alpha=0.5,
    )

    x = np.linspace(min_xy, max_xy, steps_lines)

    for c in constraints:
        if c.c_y == 0:
            ax.plot(np.ones_like(x) * (-c.c / c.c_x), x, label=str(c))
        else:
            ax.plot(x, c.to_line(x), label=str(c))

    ax.legend(loc="upper right", borderaxespad=0.0, prop={"size": 14})
    ax.set_xlabel(r"$x_1$")
    ax.set_ylabel(r"$x_2$")

    return ax
Usage
ax = make_plot(-1, 9, [
        Constraint(5, "<=", -2, 17),
        Constraint(2, "<=", -3, 10),
        Constraint(0, "<=", 1, 0),
        Constraint(1, ">=", 0, 0),
    ],
)

ax.set_ylim(-1, 6)
ax
Output

· · ·